
Mar 15 | Data Analytics & Supply Chain Projects | Machine Learning Projects
A Power BI and Python project where I analyzed retail sales performance, explored the reasons behind low profitability, and built a sales forecast to support future planning.
In this project, I worked on a retail dataset to understand how the business was performing across products, regions, and time. My goal was not just to build a retail sales analytics dashboard, but to create something that could actually help with everyday decision-making.
I used Power BI to design the interactive dashboard and Python to prepare the data and build the forecasting model. The final result naturally brings together performance tracking, profitability analysis, and sales forecasting into one place.
Retail businesses deal with a lot of moving parts. Sales may look strong overall, but profit can still be weak in certain products or regions. On top of that, planning for future demand is incredibly difficult without a clear view of historical trends.
For this project, I wanted to answer a few practical questions:
-
How is the business performing overall?
-
Which products and regions are doing well, and which ones are struggling?
-
What is exactly driving the profit loss?
-
What might sales look like in the coming months?





Here is the step-by-step breakdown of how I tackled this forecasting dashboard:
1. Data Preparation
I started by cleaning and preparing the dataset in Python. This included working with the date fields, organizing the sales data into a monthly format, and making sure the data was fully ready for both dashboarding and forecasting.
2. Performance Analysis
Once the data was clean, I built an executive dashboard in Power BI to track key metrics such as sales, profit, margin, discount level, and regional performance.
3. Profitability Analysis
After looking at the high-level view, I focused on understanding where the business was actually losing money. I created a separate analysis page to look at the impact of discounts, highlight weak product groups, and pinpoint the areas contributing most to negative profit.
4. Sales Forecasting
Finally, I built a forecasting model in Python using Prophet to project future monthly sales. I then brought those forecast results directly into Power BI, visualizing both the forecast trend and its confidence interval.
Executive Overview
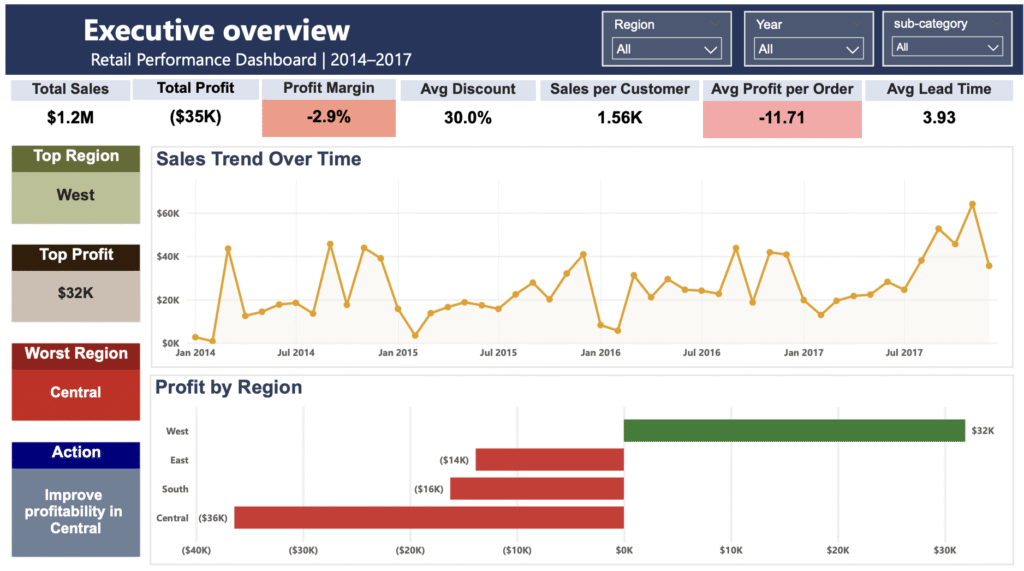
A quick summary of the business using key metrics like total sales, total profit, profit margin, average discount, and average lead time. It also highlights the strongest and weakest regions.
Product Performance
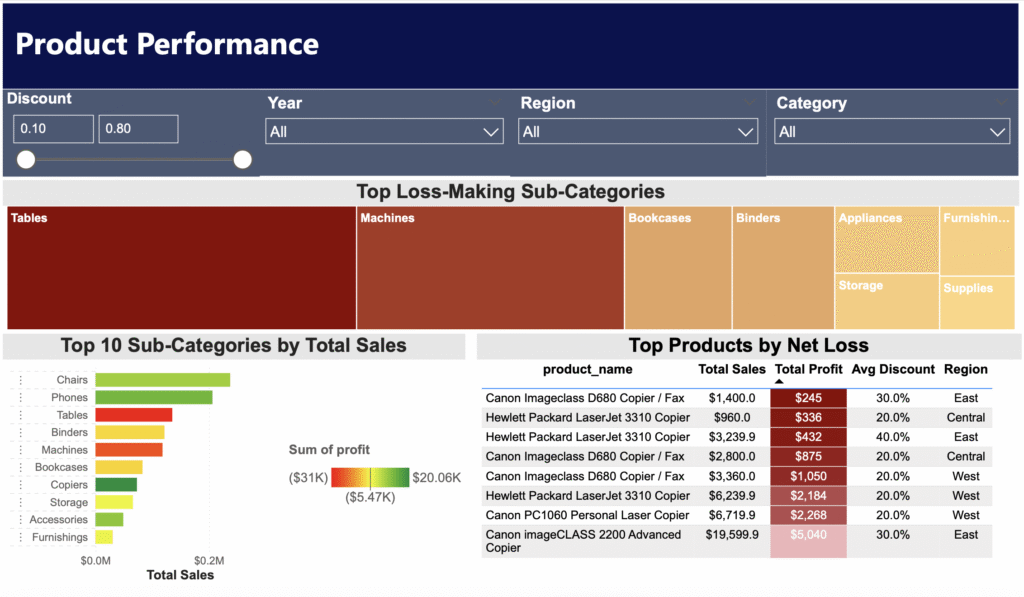
A look at category and sub-category performance, top products, and the relationship between sales and profit.
Regional Performance
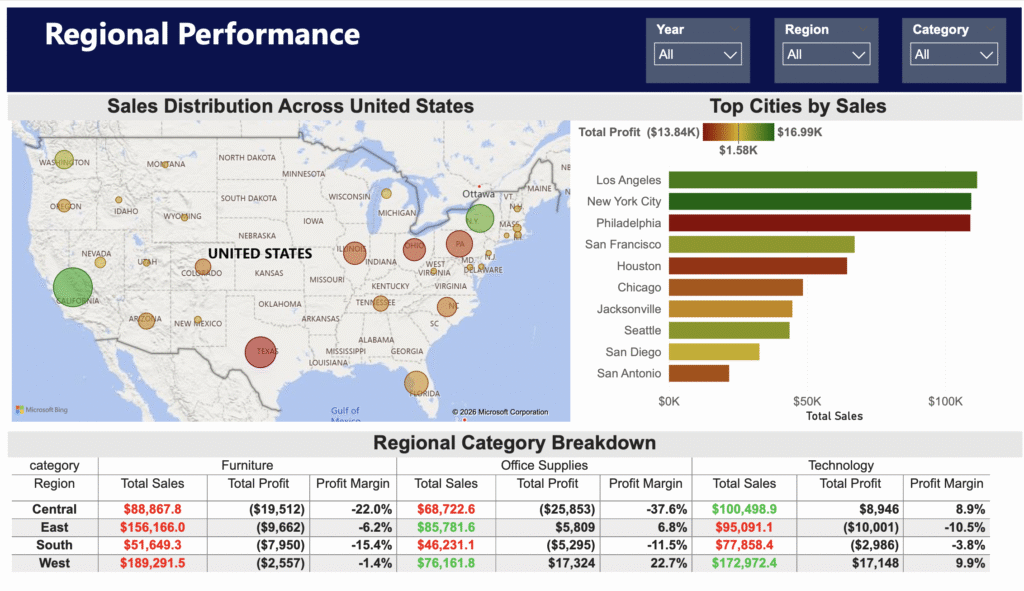
Comparing sales and profitability across regions and cities to easily identify the areas performing best and worst.
Profitability Analysis
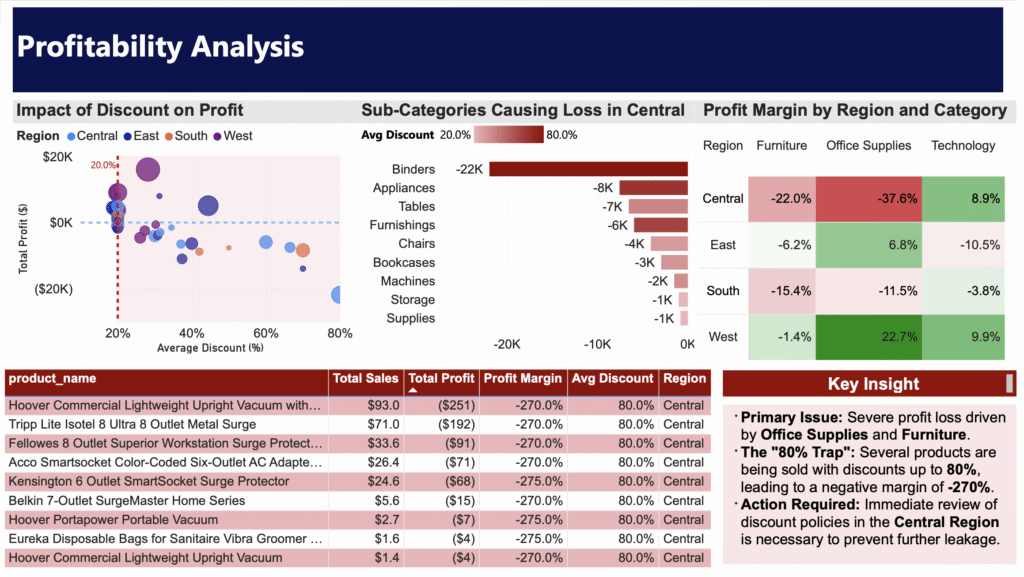
Focusing on the reasons behind low profitability, highlighting the effect of high discounting and showing which products are driving losses.
Sales Forecast
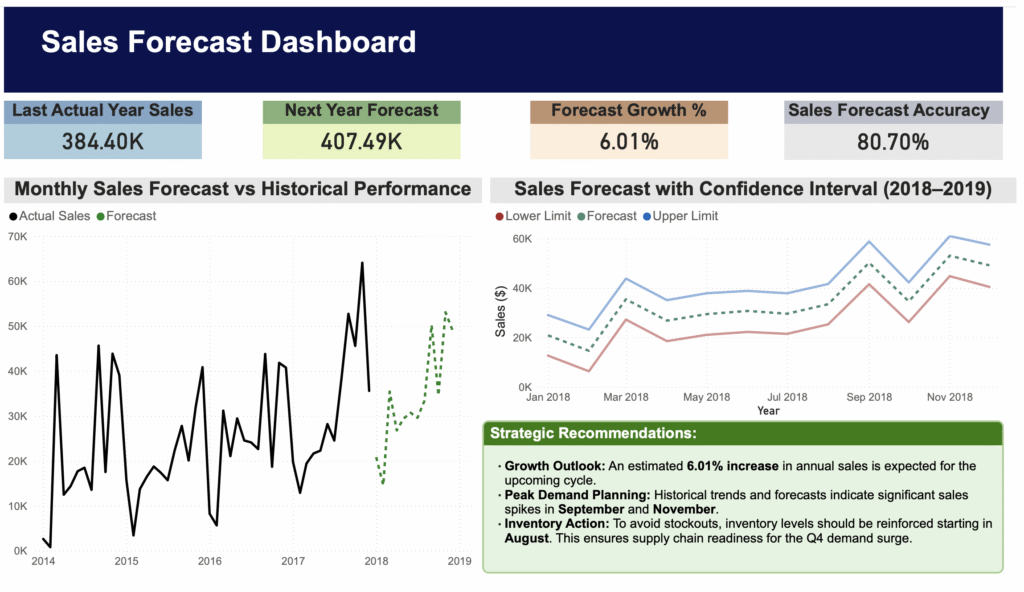
Showing the historical monthly sales trend along with forecasted future sales and the expected range around those predictions.
A few important patterns stood out in the analysis:
-
The business generated about $1.2M in total sales, but overall profit was still negative.
-
The West region performed the strongest, while the Central region had the weakest profitability.
-
Higher discounts were often linked to lower profit, especially in certain product groups.
-
Some products and sub-categories repeatedly created losses and pulled down the overall margin.
-
The forecast suggested continued growth in sales, especially later in the forecast period.
Based on the analysis, a few actions would make sense from a business point of view:
-
Revisit the discounting strategy in regions and categories with weak margins.
-
Review the products that consistently generate losses.
-
Put more focus on stronger-performing regions and product groups.
-
Use the forecast to prepare inventory for higher sales during stronger demand periods.
The sales forecast was built using historical monthly sales data. I also included a confidence interval to show the likely range of future sales values, not just a single fixed line. That makes the forecast much more realistic and easier to interpret.
I completed the full project myself from start to finish, including:
-
Cleaning and preparing the data in Python
-
Organizing the monthly sales data
-
Building the forecasting model
-
Designing the Power BI dashboard and selecting KPIs
-
Analyzing profitability issues and writing the final business insights
This project gave me the chance to combine data cleaning, dashboard design, business analysis, and forecasting in one workflow. More importantly, it helped me turn raw retail data into insights that could actually support better decisions.
