

An industrial engineering case study focused on production, quality, downtime, machine performance, and optimization
This project analyzes a simulated production system using Excel from an industrial engineering perspective. The work focuses on output, defects, downtime, machine performance, and optimization, with the goal of turning raw production data into actionable operational insights.
Main objectives
-
Identify the least productive shift
-
Compare defect rates across product types
-
Detect operators with the highest defect levels
-
Measure downtime across production lines
-
Compare machine efficiency across lines
-
Use Solver to improve production planning and operator assignment
-
Add Pareto and OEE analysis to strengthen decision-making
- Microsoft Excel
- Pivot Tables
- IF / Nested IF
- VLOOKUP
- INDEX/MATCH
- Solver
- Pareto Analysis
- Estimated OEE Analysis
The project uses a simulated production dataset with variables such as shift, line, product type, units produced, defects, downtime, operator ID, and machine efficiency. The analysis was built in Excel using structured tables, summary calculations, lookup formulas, charts, and optimization models.
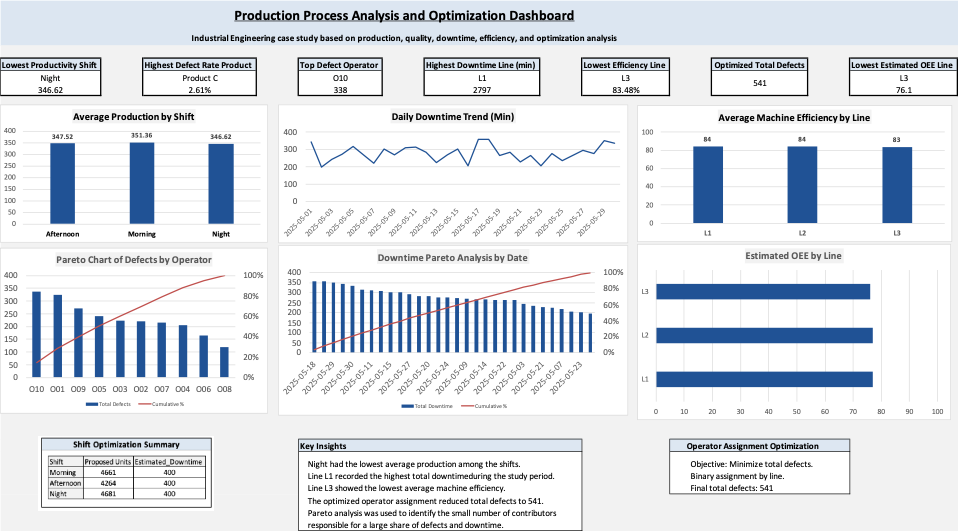
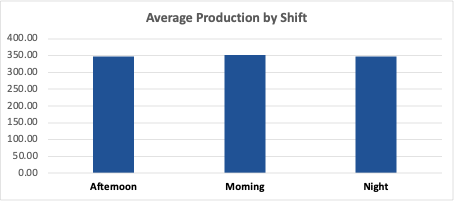
- Night had the lowest average production
- Product C showed the highest defect rate
- Operator O10 recorded the highest total defects
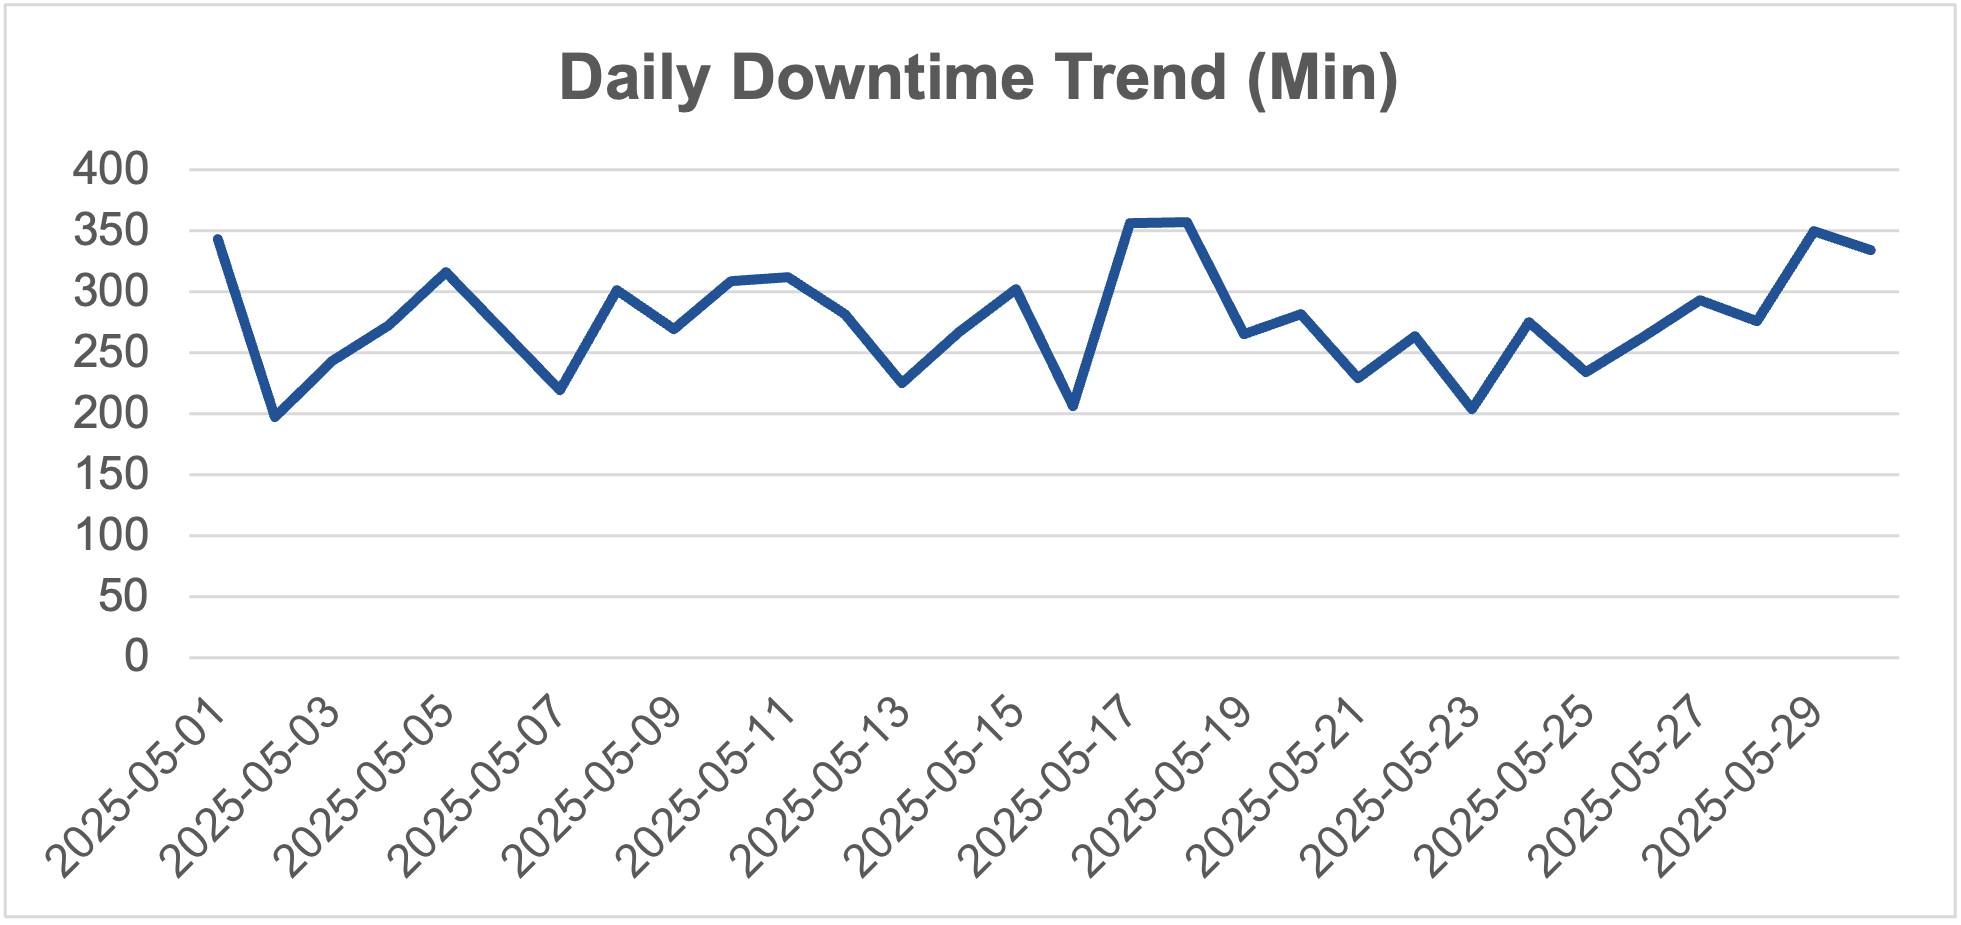
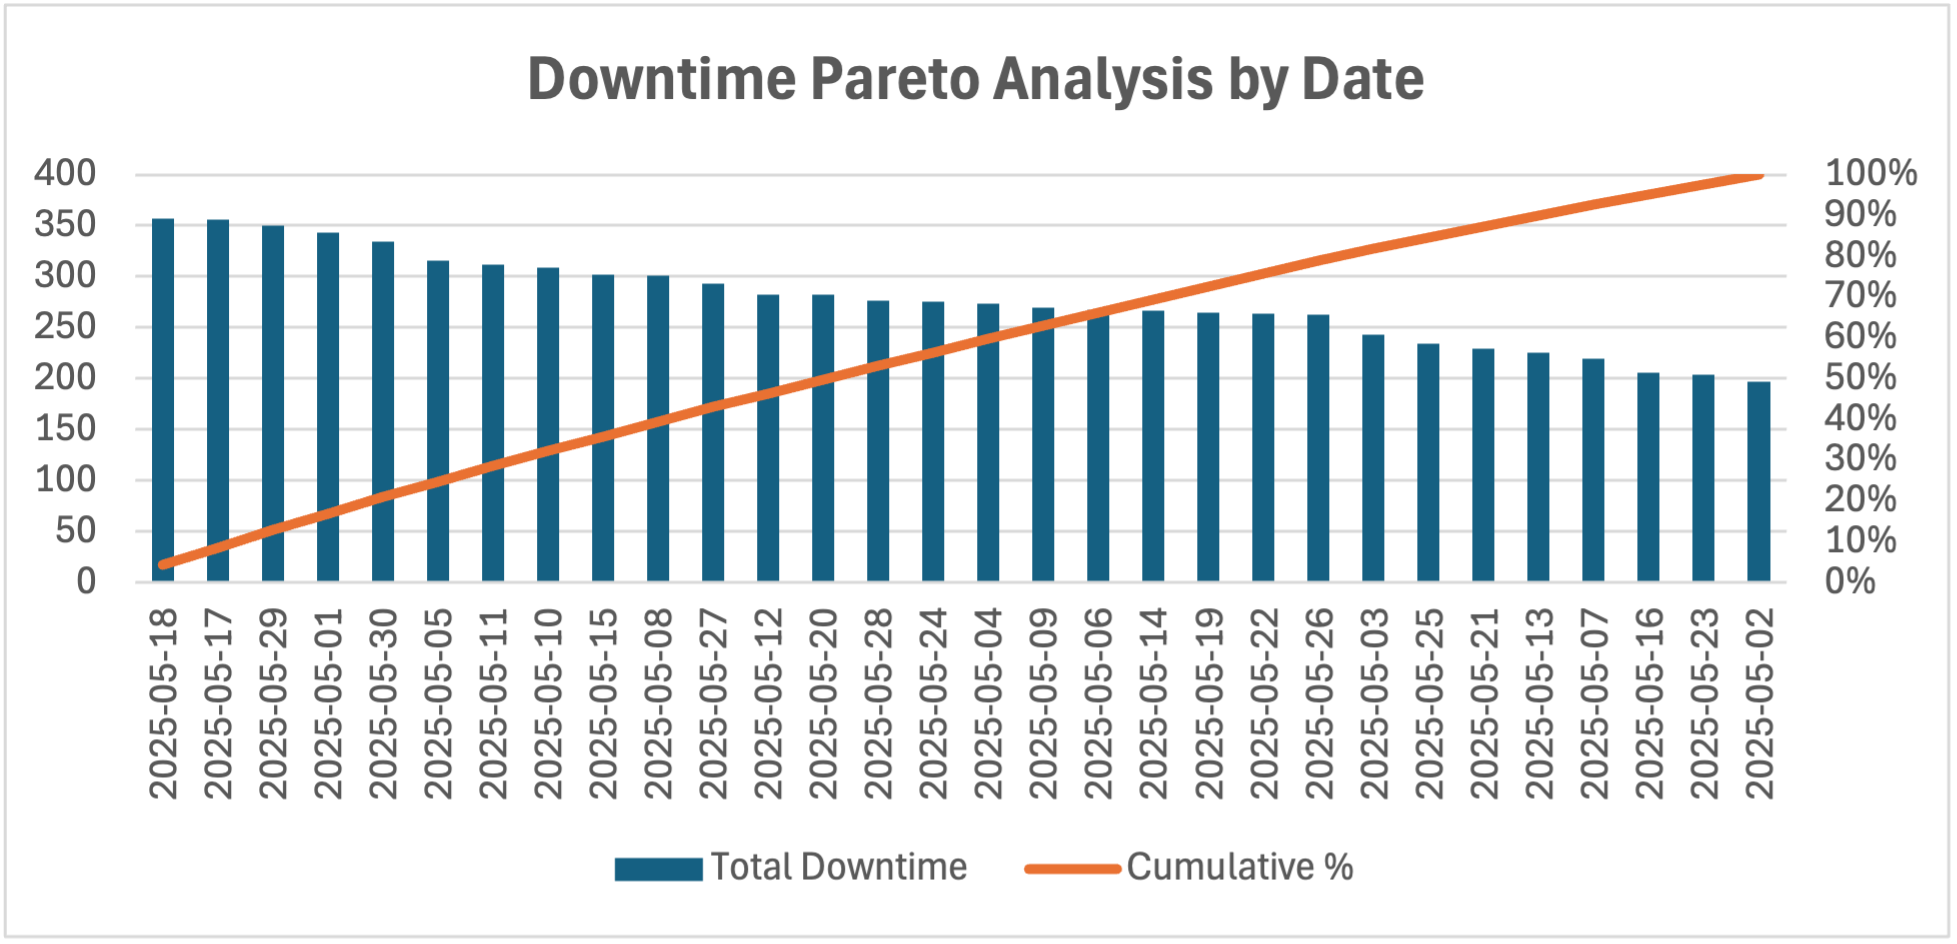
- Line L1 had the highest total downtime
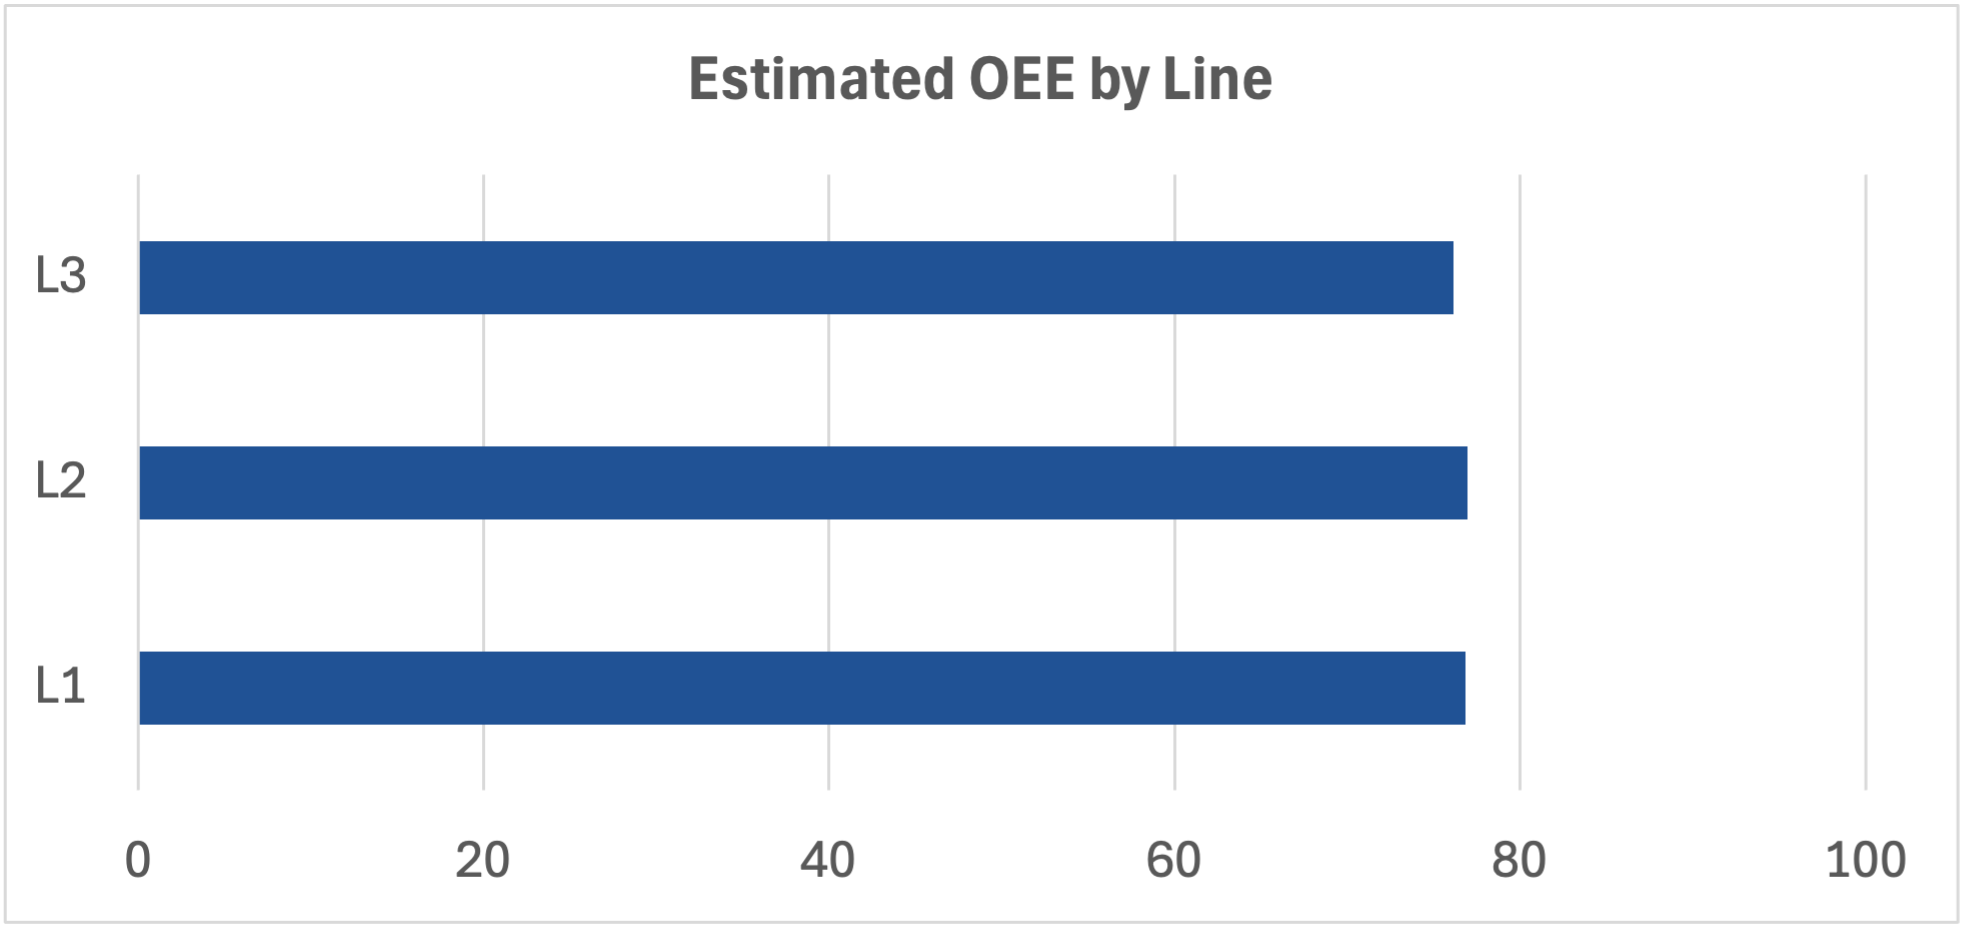
- Line L3 had the lowest average machine efficiency
- The optimized operator assignment reduced total defects to 541
- Estimated OEE provided a more complete view of line performance
- Pareto analysis highlighted the small number of contributors responsible for a large share of defects and downtime
Dashboard screenshot
Optimization Models
Two Solver models were developed in this project. The first model optimized shift-based production planning under downtime constraints. The second assigned operators to production lines in a way that minimized total defects using binary decision variables.
Shift Optimization
-
Objective: Maximize total production
-
Constraint: downtime limit per shift
-
Result: optimized production allocation across Morning, Afternoon, and Night shifts
Operator Assignment Optimization
-
Objective: Minimize total defects
-
Decision variables: X_L1, X_L2, X_L3
-
Result: total defects reduced to 541
What makes this project stronger
-
Pareto analysis was added to prioritize the few contributors responsible for most defects and downtime
-
Estimated OEE analysis was added to go beyond machine efficiency alone
-
The project combines descriptive analysis, Excel logic, and optimization in one case study
This project helped demonstrate how Excel can be used not only for reporting, but also for operational analysis and decision support. It combines industrial engineering thinking with practical tools that can be applied to production systems, process improvement, and resource allocation problems.